 (4 votes, average: 5.00 out of 5)
Mark | Poker Articles, Poker Mathematics, Poker Tools
This article is a part of the Poker Mathematics series.
Recently I have wondered if it is possible to calculate the probability of winning a poker tournament based on which strategy you use and how your all in moves are distributed. During the process of collecting data to solve this problem I have run into some interesting observations which I would like to share with you (warning: math content ahead). First a little teaser….my findings indicate that it is possible to make good mathematical estimations on how many hours it will take before the final table in a tournament is reached based on the number of players registered for the tournament:
In the table below you will get a feel for how many hours you will have to play to reach the final table based on the number of players registered.
| Registed players | Hours until final table is reached (9 players remaining) |
| 50 | 1,8 |
| 100 | 2,6 |
| 200 | 3,3 |
| 300 | 3,8 |
| 400 | 4,2 |
| 500 | 4,5 |
| 600 | 4,8 |
| 700 | 5 |
In the following table you will get a feel for the size of tournament you should choose given the time you have available.
| Hours available to play | Maximum number registered players (not including final table) |
| 1 | 23 |
| 2 | 60 |
| 3 | 149 |
| 4 | 343 |
| 5 | 686 |
| 6 | 1110 |
Here’s a recollection of how I calculated the numbers above:
My tournament statistics project is based on online poker tournaments at Fulltilt poker and more precisely freezeout tournaments (i.e no rebuys and add ons). First of all, I came to realize that I would need to be able to estimate the number of players in an MTT given the time it takes for the tournament to finish. For example if a tournament lasts 3 hours, how many players were registered to play in it from the beginning?
What I did was to note down the following information for 25 online poker freezeout tournament on Fulltilt poker:
- The time the tournament had been running
- The number of players registered
- The number of players remaining
From this data set I was able to calculate the exit percentages, that is the relative number in percent of player exits, and plot them against the time the tournaments had been running. For example, in one tournament running for 3 hours and 28 minutes, 611 players registered and of them 25 remained yielding an exit percentage 95,9%.
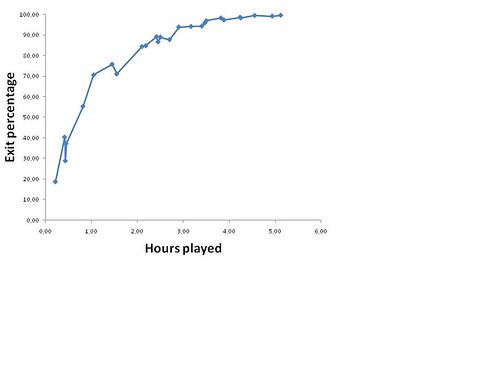
Player exit percentage raw data
I was quite surprised to see the raw data plot shown above because it indicates an exponential mathematical relationship between the exit percentage and the time an online freezeout tournament has been running for. This relationship seems to be independent of the buyin of the tournament and the number of players entering.
I transferred the raw data to Origin and did a peak fit analysis to determine the mathematical relationship between the exit percentage (EP) and the hours played (x). Based on my original data set I imposed the following boundary conditions:
- EP(x=0)=0% : No players exit the tournament before it starts
- EP(x=6 hours) = 100% : All the freezeout tournaments I sampled had ended within 6 hours
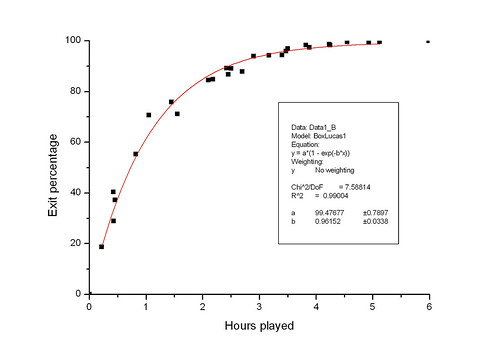
Player exit percentage fitted data
Turned out the relationship was exponential as expected:
- EP(x) = A(1-exp(-Bx)), in this case A was 99,5 and B was 0,96
Now here comes Now here comes the interesting part. Given the equation above, relating the exit percentage with the number of hours played, it is now possible to estimate both the hours it takes a tournament to finish and the inverse, namely the number of players entering into a tournament given the hours it takes to finish.
Since I’m not able to paste Excel formulas into WordPress blog posts, I have made some tables with some sample data just to give you an idea of how you can use the formula.
In the table below you will get a feel for how many hours you will have to play to reach the final table based on the number of players registered.
| Registed players | Hours until final table is reached (9 players remaining) |
| 50 | 1,8 |
| 100 | 2,6 |
| 200 | 3,3 |
| 300 | 3,8 |
| 400 | 4,2 |
| 500 | 4,5 |
| 600 | 4,8 |
| 700 | 5 |
In the following table you will get a feel for the size of tournament you should choose given the time you have available.
| Hours available to play | Maximum number registered players (not including final table) |
| 1 | 23 |
| 2 | 60 |
| 3 | 149 |
| 4 | 343 |
| 5 | 686 |
| 6 | 1110 |
Hope you found the information in this article useful. If you have any comments or want a copy of the Excel spreadsheet I used to calculate the data in the tables, please let me know.
You could be posting your articles on the Poker Bankroll Blog. Read all about it here.
Similar Posts:
7 Comments to Online poker tournament statistics: player exit percentage
Your math is pretty much right on. I was just in a tournament with 947 entrants. I was out after 5:15 but the tourney lasted just about six hours. That is good information to know. That way you can pace yourself, make sure you have refreshments and breaks and exercise as needed. This is just as bad as being in an airplane for a long period of time. Perhaps worse, when you add the stress levels.
March 3, 2009
Hi Steve
Thanks for your feedback. Glad to hear my math holds up.
Mark’s last blog post..Poker tournament bonus search
March 11, 2009
Good article Mark. I always had an idea about this, now there is proof. Good thing to know the next time I decide to play in an MTT.
McTap03’s last blog post..March Goals
March 11, 2009
Interesting analysis.
Obviously such results depend also on a number of additional factors:
1/ on the blind/ante structure in relation to initial stack,
2/ on the buy-in, low buy-in might have looser play and faster eliminations, I guess,
3/ on the poker site, smaller site may have more fish than pokerstars,
4/ on the day of the week, the weekend crowd being different from Tuesday early birds.
Also the time for the final table to unfold will vary a lot. That is why the right end side of the curve is nearly horizontal.
March 11, 2009
Hi Conrad
You are spot on with your additional factors. I have only investigated regular NL hold’em tournaments at Full Tilt Poker with buyins up to about 20$.
Could be interesting to make a more detailed analysis including more of the factors you mention.
March 11, 2009
In fact, the final table effect that I mentioned is not really related to horizontal curve, but more so to larger variance on the right side than left side. If you represented variance.
Or to say that in simpler terms. If there are 100 participants in a tournament, you could be fairly certain of when there will be 80 left, given the factors; but you will be much more uncertain of when there will be 5 left for example.
This is due to 2 effects (i) the more time passes, the more uncertainty, and (ii) late stage play is less predictable as far as time is concerned.
March 12, 2009
I agree…that’s why the numbers in the tables don’t include the final table, where I assumed the variance to be the largest.
I wanted to keep things relatively simple…
Mark’s last blog post..U.S. Waves the Hoover Flag
Leave a comment
Special promotions
Latest Poker Strategy Articles
-
Haie kehren zurück – und diesmal beißen sie richtig zu!
-
Why Texas Hold’em Basics Still Matter
-
How to Skillfully Navigate Various Online Poker Games in 2025
-
Canadian Delight: Exploring the Top Online Slots of 2024
-
The Ultimate Guide to Gambling and Betting in Australia: 2024 Edition
-
Unveiling the Top New Online Slot Games of 2024: A Must-Try List!
-
From Beginner to Winner: Essential Advice for Excelling in Australian Real Money Casinos
-
Exploring the Thrill of Live Poker Events Around the World
-
How to beat tougher poker players
-
What Are the Most Widely Played Poker Games?
-
Payment Options at Online Casino Platforms
-
New York introduces online casino bill
-
Which Poker Game Should I Play when Gambling Online
-
How to bluff effectively in poker
-
How to Manage Your Crypto Bankroll When Playing Poker
-
Online Casino Bankroll Best Practices You MUST Do
-
What is The Gambler’s Fallacy, and Should You Believe It?
-
How to Play Texas Holdem – Hands and Rules
-
Things You Should Never Do in Online Poker
-
How Poker can boost your mental acuity
-
The importance of imagery for online casinos
-
What Are the Types of Poker Games You Can Play?
-
How to Celebrate When You Win Money Playing Poker Online
-
The Most Efficient Methods of Improving Your Poker Game
-
The Popularity of Online Gambling Due to the Accessibility of Mobile Phones
-
The Single Best Tip for Poker Improvement
-
The Best Online Casino Games with Dice
-
Five Tips on Choosing the Fastest Payout Slot Sites
-
Upcoming Poker Tournaments 2021
-
The history of blackjack and why it so popular
March 2, 2009